
Ethereum’s price has been a rollercoaster lately. After briefly hitting $2,000, it dipped again following recent US inflation news. This shows Ethereum’s struggles, underperforming even during a broader market upswing. But a key indicator suggests a potential turnaround.
A Key Indicator Points to a Possible Bottom
A market expert, Tony Severino, noticed something interesting: Ethereum’s monthly Relative Strength Index (RSI) is at a level last seen during the 2018 bear market.
What is RSI?
The RSI is a tool that helps measure how quickly and dramatically an asset’s price changes. A reading above 70 usually means a market is “overbought” (likely to drop), while below 30 suggests it’s “oversold” (likely to rise).
History Repeating Itself?
Severino points out that Ethereum’s RSI hit this low point before bouncing back strongly in both 2022 and after the 2018 crypto crash. In 2018, after hitting this low RSI, Ethereum’s price soared by almost 4000%! A similar rebound happened in early 2024 after the 2022 low.
But There’s a Catch
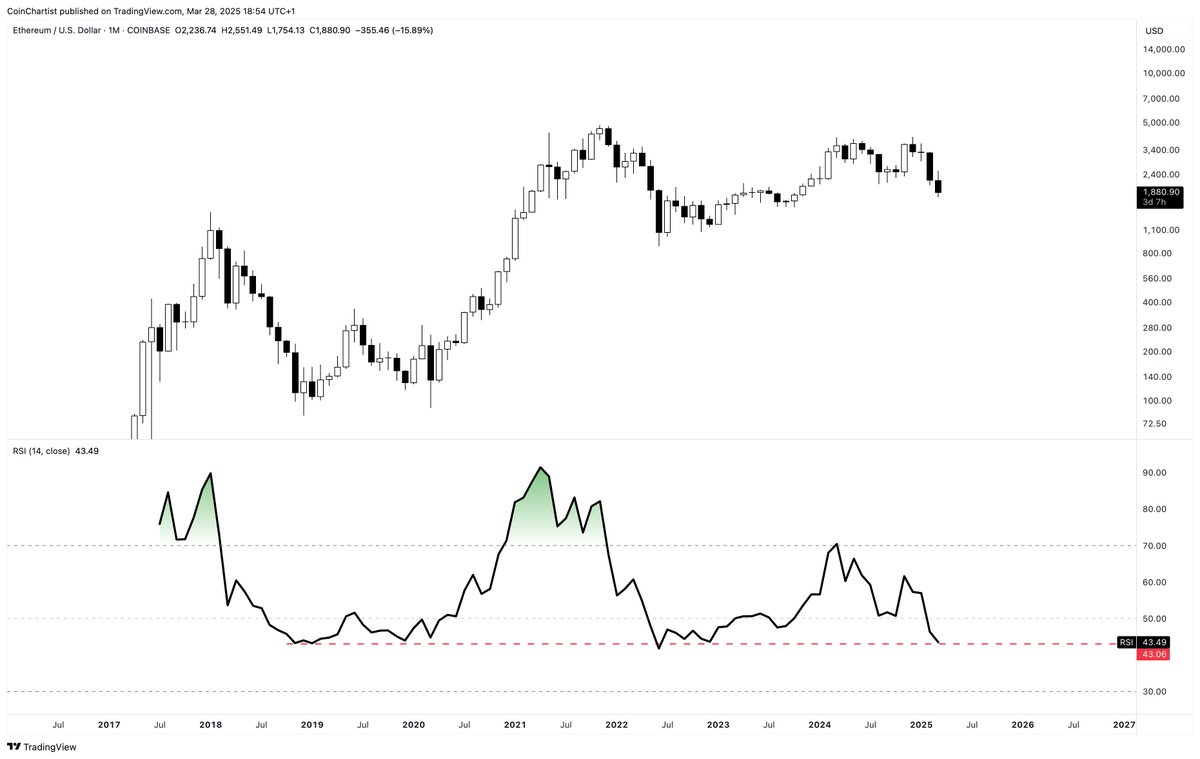
While history is encouraging, there’s a crucial difference. In 2018, Ethereum’s price had fallen by a whopping 94% from its peak before the RSI hit bottom. This time, the drop is only around 56% from its recent high and 63% from its all-time high. This means a further price drop is still possible.
Current Ethereum Price
At the time of writing, Ethereum is trading around $1,880, down about 7% in the last 24 hours. The question remains: will history repeat itself, or will Ethereum continue its downward trend?


