
Bitcoin recently hit a new high above $97,000, but then dipped slightly to around $94,000. While short-term price swings are making traders nervous, some longer-term indicators suggest a potential bullish shift.
A Bullish Index?
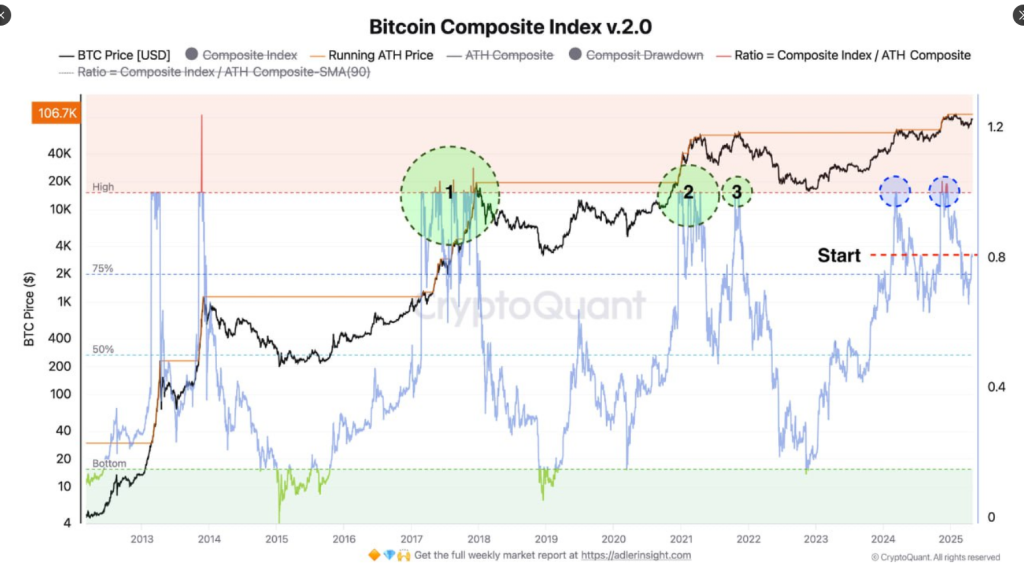
One key indicator, the Bitcoin Composite Index v2.0, currently sits at 0.8. This index combines price action with blockchain activity to predict Bitcoin’s future movement. Analyst Constantin Kogan notes that similar readings preceded major price rallies in 2017 and 2021. If the index hits 1.0 and stays there, Kogan believes Bitcoin could see a significant price surge. A key component of the index, “Running ATH Price,” is also trending upwards, suggesting increased buyer confidence.
Three Possible Scenarios:
- Bullish: A continued rise could push Bitcoin to $150,000-$175,000.
- Neutral: If the index stays between 0.8 and 1.0, Bitcoin might trade sideways between $90,000 and $110,000.
- Bearish: A drop below 0.75 could lead to a correction down to $70,000-$85,000.
Supply Zone Holds the Key
Another indicator, the UTXO Realized Price Distribution (URPD) chart, shows where Bitcoin holders last moved their coins. A large number of buyers entered the market between $93,000 and $98,000, creating a significant supply zone. Bitcoin’s current price of around $94,000 puts it right in the middle of this zone.
Breakout or Breakdown?
The next move will depend on whether Bitcoin breaks out of this supply zone or gets rejected. A strong breakout could trigger further price increases, while a failure to break through could lead to lower prices and more selling pressure.
The Waiting Game
For now, Bitcoin is in a holding pattern. Traders and analysts are closely watching both the Composite Index and the supply zone to determine whether the current situation leads to a significant price increase or a further decline.


