Bitcoin’s price has been fluctuating around $67,000 lately, but it’s not likely to stay there for long.
Inverse Head and Shoulders Pattern Emerges
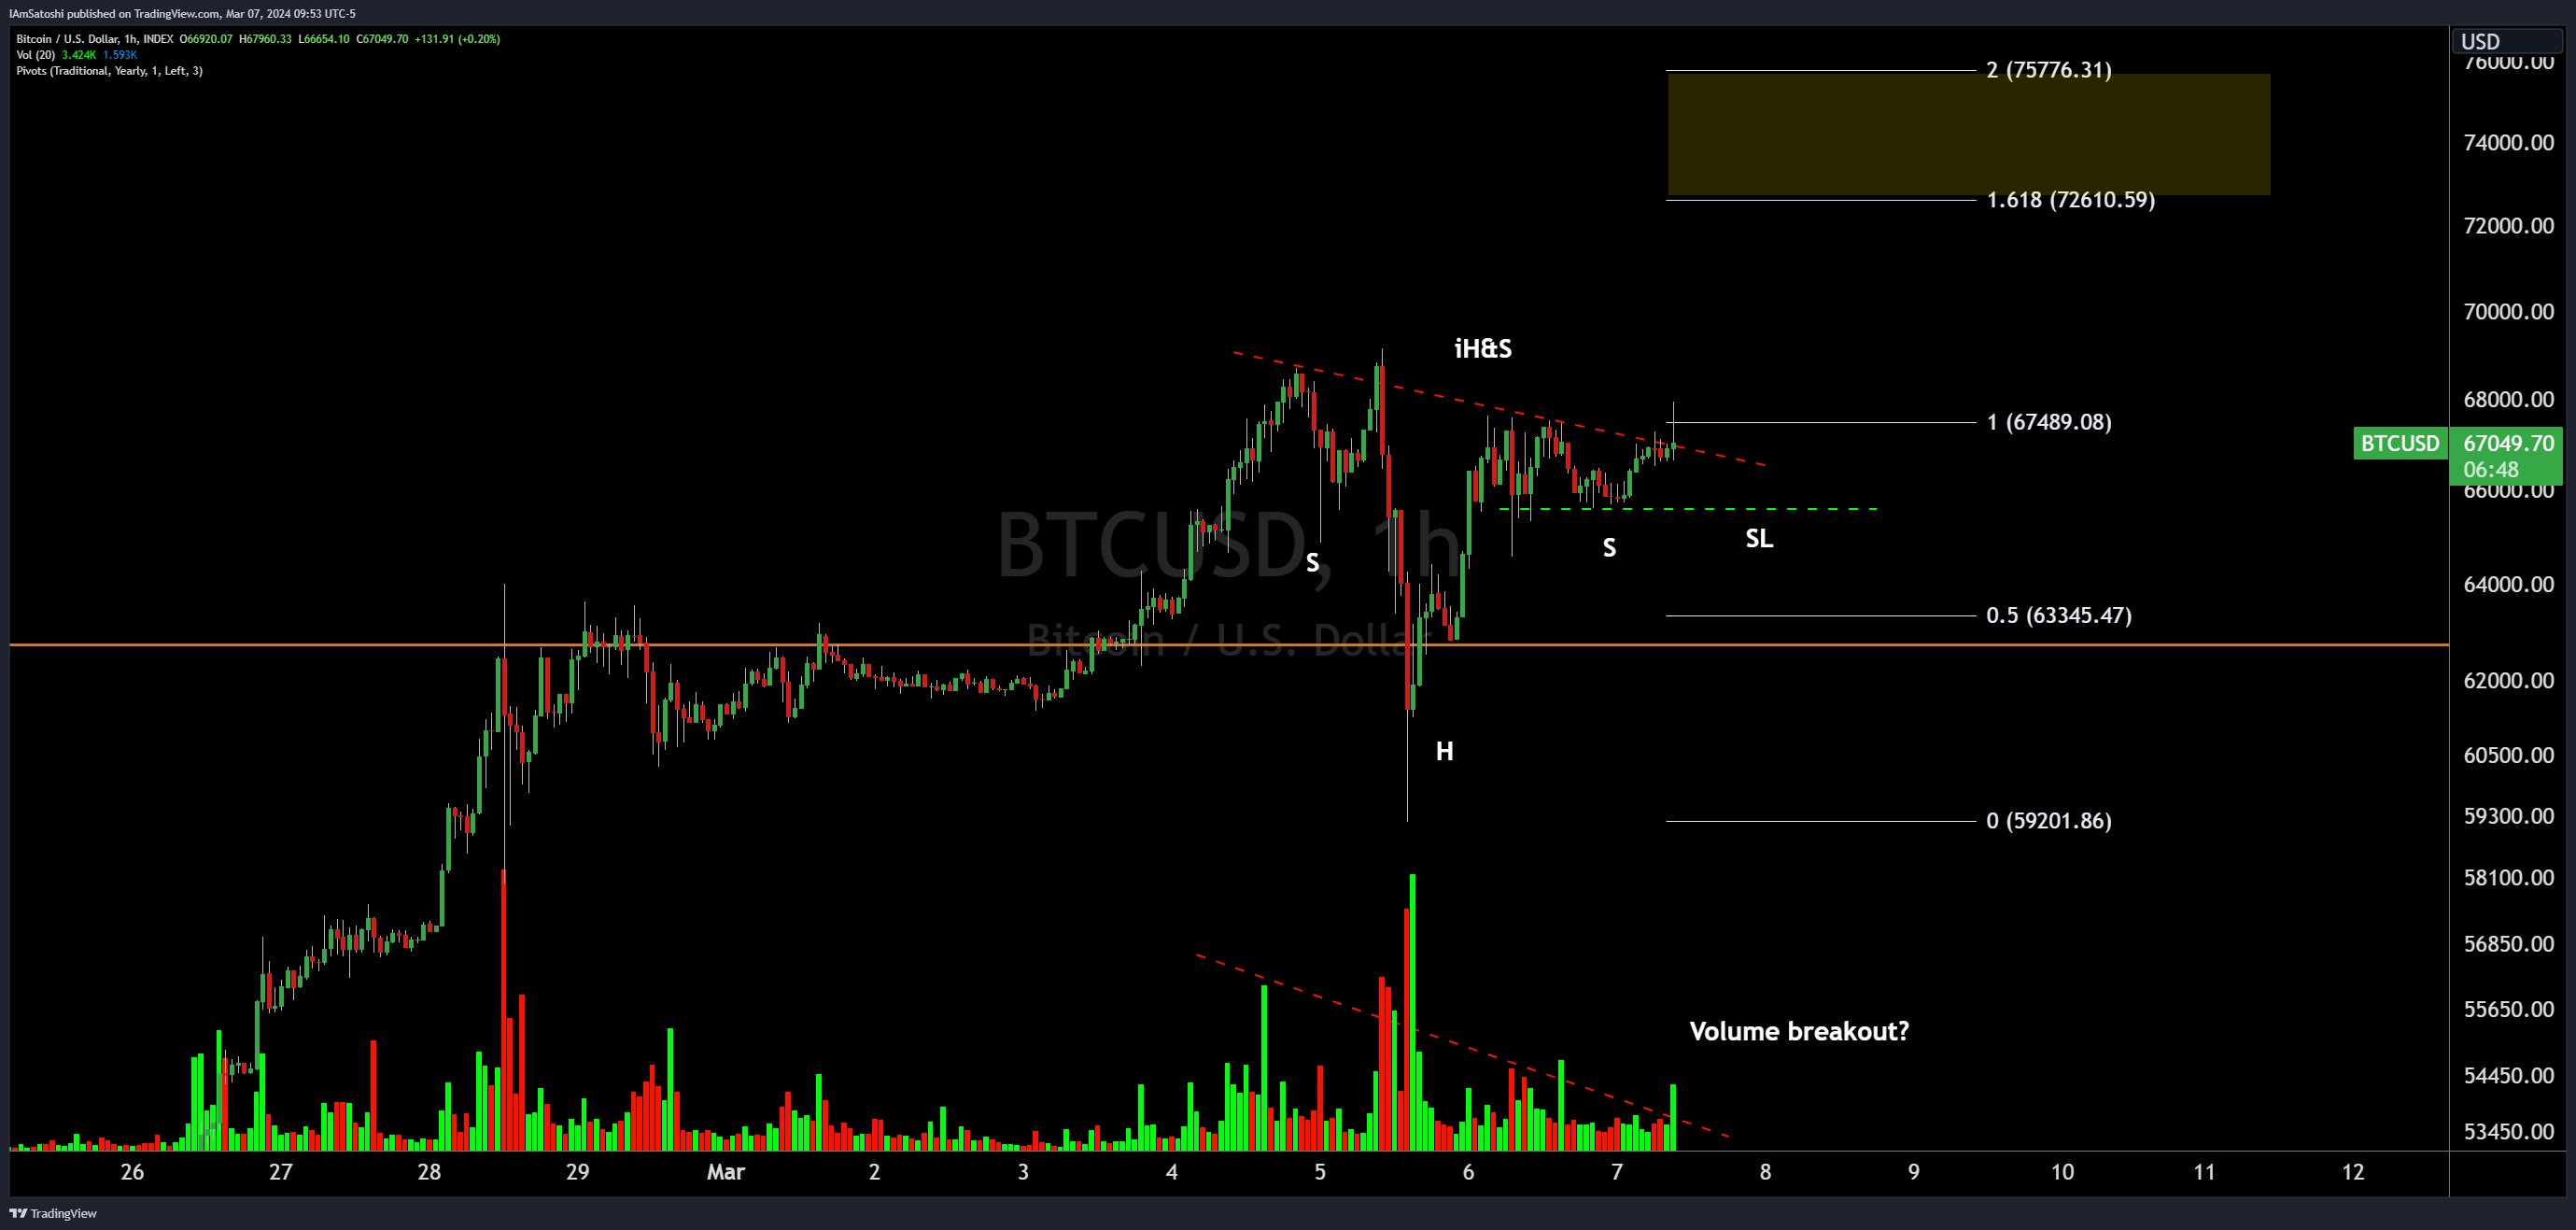
Crypto analyst Josh Olszewicz has identified an inverse head and shoulders (iH&S) pattern on Bitcoin’s 1-hour chart. This pattern is often seen as a sign of a potential price increase.
The iH&S pattern has three troughs, with the middle one being the lowest. It looks like a head and two shoulders, but flipped upside down. In Bitcoin’s case, the head is at $59,000, and the shoulders are around $65,000 and $65,700.

Potential Targets and Confirmation
Traders often use iH&S patterns to find potential buying opportunities. Olszewicz believes that Bitcoin could reach $73,000 to $76,000 if the pattern holds. These targets are based on Fibonacci extension levels.
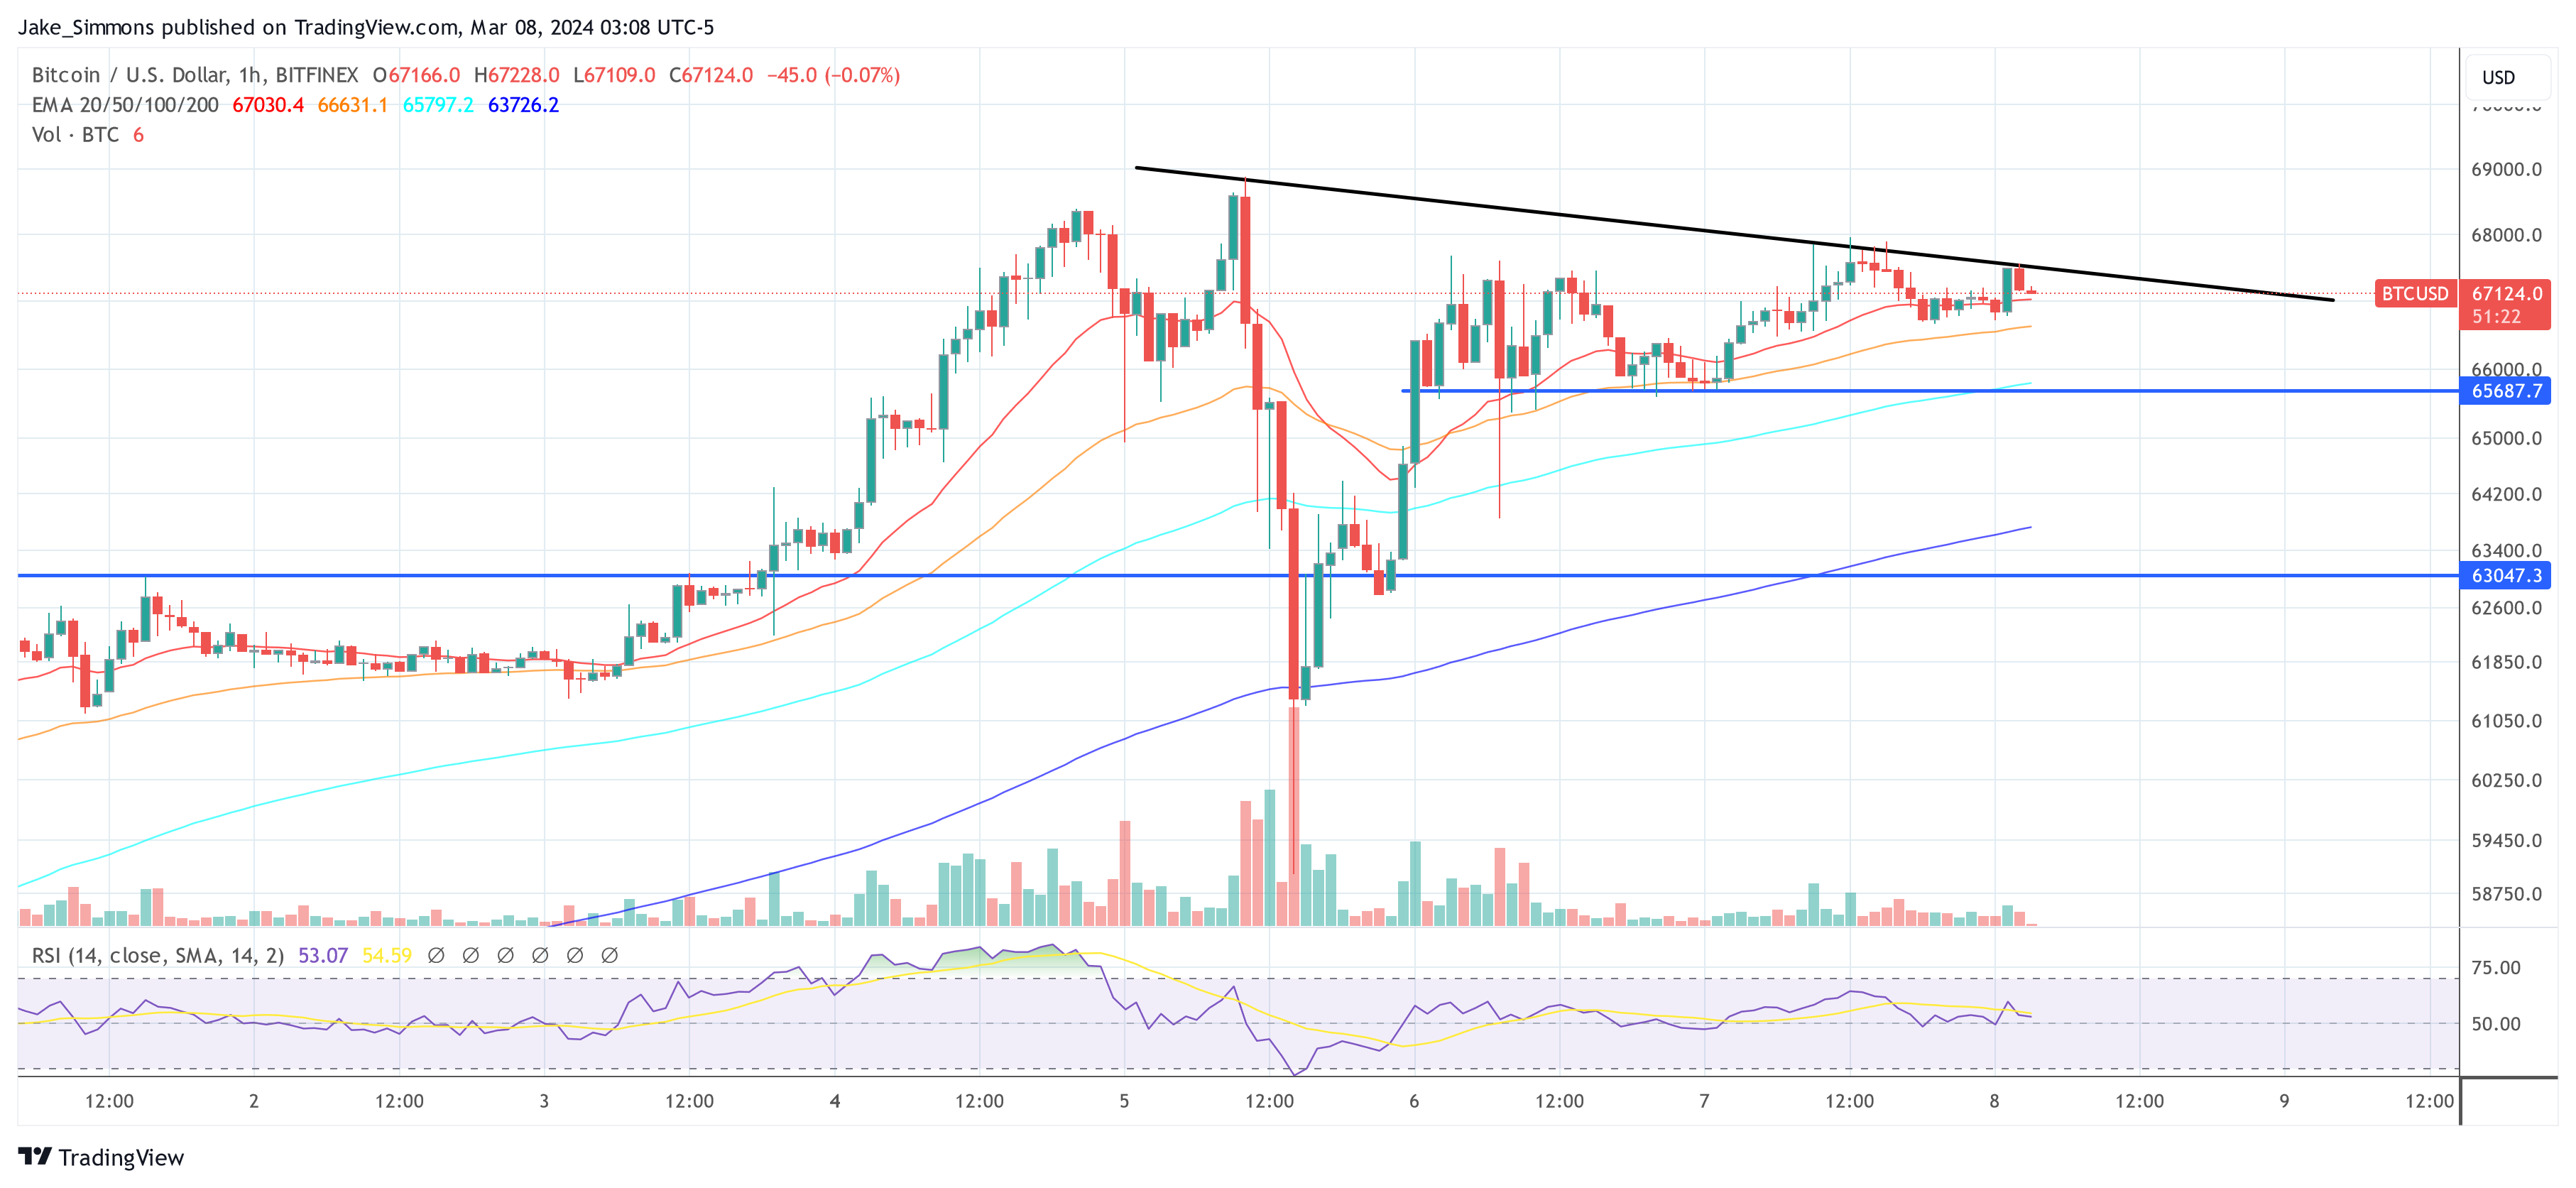
To confirm the pattern, Bitcoin needs to break above the neckline, which is a dotted red line on the chart. The neckline intersects with the right shoulder in the coming days.
Volume and Stop Loss
Volume is an important factor to consider when looking at iH&S patterns. A surge in volume can confirm the pattern. Olszewicz has marked a potential stop loss (SL) level at $65,680. This level is a risk management tool if the pattern fails.
Current Price and Conclusion

As of now, Bitcoin is trading just below the neckline. If the pattern holds, we could see a significant price increase in the coming days.


